Gartner SAM Tools Magic Quadrant & Critical Capabilities reports

Gartner this week published their first ever research into the SAM Tools marketplace and the results are a mix of surprises and expectations.
It is great for the industry to see some focus from Gartner on the SAM marketplace. Overall this should help SAM professionals and tools vendors get airtime with C-Suite members and also provides a good summary of the current SAM Tools space. It will also drive innovation and encourage competition.
However, it is important to understand Gartner’s basis for inclusion before jumping to conclusions based on the Magic Quadrant rankings. Gartner’s inclusion criteria are somewhat restrictive meaning, for example, a SAM Services vendor will be disadvantaged and potentially not included compared to a tools vendor focused on marketing a tool. There were also a number of financial and market size criteria to be met for inclusion.
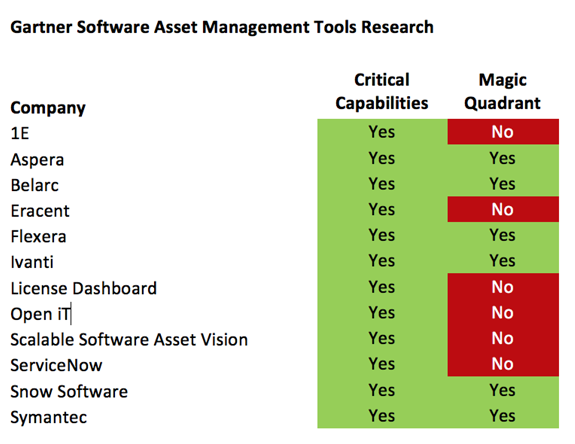
Alongside the MQ Gartner also published a Critical Capabilities report. This is a more in-depth analysis of the specifics of a tool against a Gartner-devised set of capabilities. In short, similar to a scoring matrix one would use for an RFI. The tool list for the Critical Capabilities report is larger than that for the MQ.

What are your thoughts on the lists above? Which vendors are you surprised to see missing? Any surprises around the inclusions? (Join the conversation and grab a free copy of the Magic Quadrant here).
ITAM Review will continue to conduct original research on the wider ITAM marketplace, including SAM Managed Services Providers and SAM Consultancies that wouldn’t have been eligible for the Gartner reports. As the 12-box model indicates SAM is not just about the toolset – people and processes are also vital to delivering a world-class SAM programme.
Related articles:
- Tags: gartner · Magic Quadrant

Great first article AJ! I don’t think I personally learnt much than I knew already on the technologies selected, the surprises were really some of the excluded and included vendors that made the final MQ. As I tell my customers all the time, it’s about context and the criteria selected isn’t perhaps fully transparent to everyone!
https://www.gartner.com/reviews/market/software-asset-management-tools is another link I saw that’s effectively similar to your Tools Review.
I’d also like to understand if any of the functionality was tested or is this a paper exercise on how it works…
I’m gutted they didn’t assess ServiceNow. The only reason I could think why they didn’t is it isn’t a standalone module. However given the market share of ServiceNow, and the pressure that many software asset managers will be under from their management teams to go down the ServiceNow SAM route, that seems like a crazy reason to exclude them.
Firstly, welcome to the ITAM Review AJ….
I think those in the industry were looking for something a bit meatier, and so as yourself and Stuart highlighted above, making the MQ because you are on many continents, or have a turnover of $10M+ per annum speaks more of a company’s size and sales function rather than the merits of a given product.
This then results in a very light MQ – and perhaps a qualification around that $10M revenue figure would be beneficial: if that marker is to be used in future, I’d want to make sure that $10M came from SAM business; as big as the company might be, I wonder if Symantec could demonstrate that level of revenue generation solely in SAM suite sales.
I guess we have to start somewhere tho….
Free copy from Microsoft here: https://www.microsoft.com/en-us/sam/gartner-magic-quadrant-for-sam-tools.aspx